Solutions
Device management
Remotely manage, and protect laptops and mobile devices.
Orchestration
Automate tasks across devices, from app installs to scripts.
Software management
Inventory, patch, and manage installed software.
Infrastructure as code
See every change, undo any error, repeat every success.
Extend Fleet
Integrate your favorite tools with Fleet.
Customers
Pricing
More
Device management
Remotely manage, and protect laptops and mobile devices.
Orchestration
Automate tasks across devices, from app installs to scripts.
Software management
Inventory, patch, and manage installed software.
Infrastructure as code
See every change, undo any error, repeat every success.
Extend Fleet
Integrate your favorite tools with Fleet.
Reference architectures
Reference architectures

On this page:
On this page
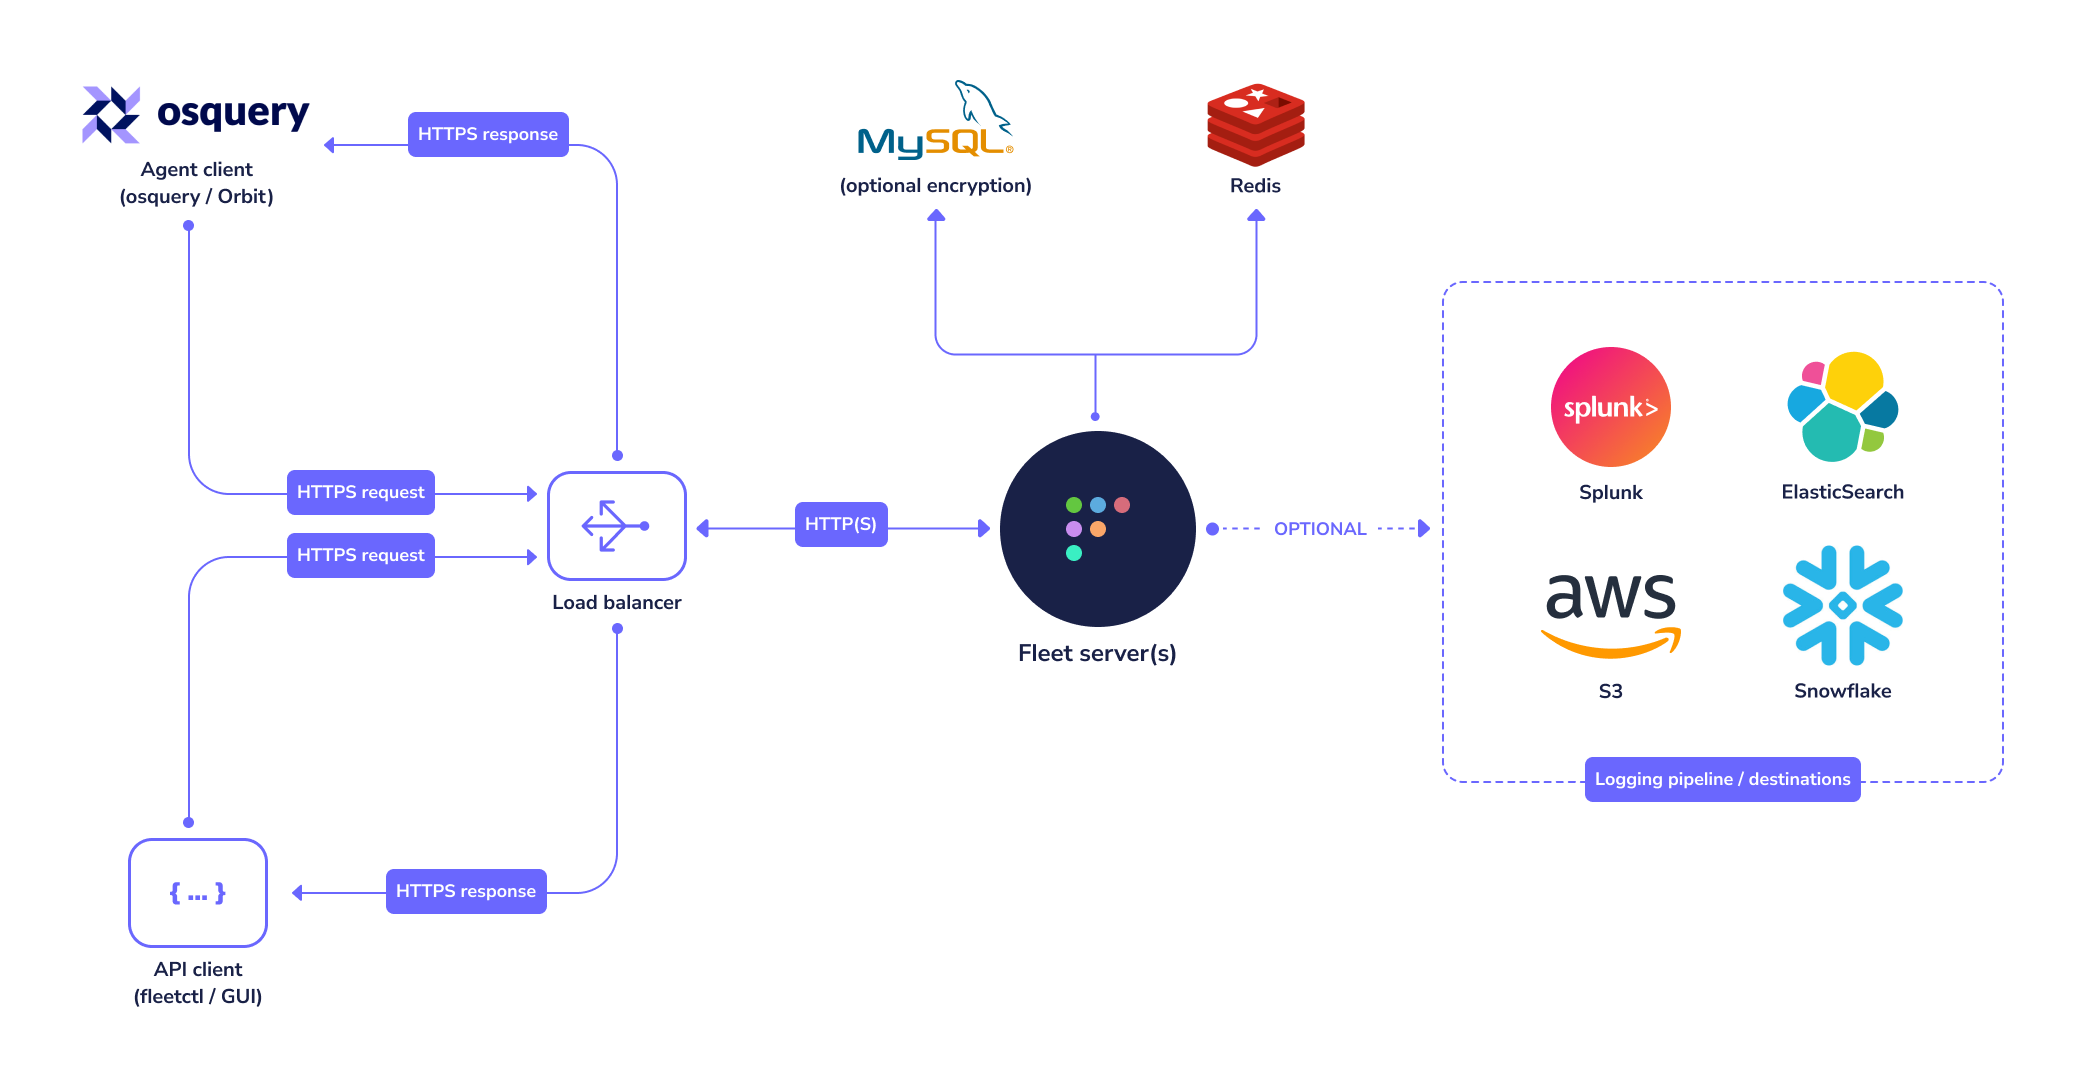
Reference architectures
The Fleet binary
The Fleet application contains two single static binaries which provide web based administration, a REST API, and a CLI interface.
The fleet binary contains:
- The Fleet TLS web server (no external webserver is required but it supports a proxy if desired)
- The Fleet web interface
- The Fleet application management REST API
- The Fleet osquery API endpoints
The fleetctl binary is the CLI interface which allows management of your deployment, scriptable live queries, and easy integration into your existing logging, alerting, reporting, and management infrastructure.
Both binaries are available for download from our repo.
Once you've downloaded the binaries, extract the files to your desired location:
tar -xf fleet_v*_linux.tar.gz # Extract the Fleet binary
sudo cp fleet_v*_linux/fleet /usr/bin/ # Copy the the Fleet binary to /usr/bin
fleet version # Sanity check to make sure it runs as expected
Infrastructure dependencies
Fleet currently has three infrastructure dependencies: MySQL, Redis, and a TLS certificate.
MySQL
Fleet uses MySQL extensively as its main database. Many cloud providers (such as AWS and GCP) host reliable MySQL services which you may consider for this purpose. A well-supported MySQL Docker image also exists if you would rather run MySQL in a container.
For more information on how to configure the fleet binary to use the correct MySQL instance, see the MySQL configuration documentation.
Fleet requires at least MySQL version 8.0.36, and is tested using the InnoDB storage engine with versions 8.0.36, 8.4.7, and 9.5.0.
There are many "drop-in replacements" for MySQL available. If you'd like to experiment with some bleeding-edge technology and use Fleet with one of these alternative database servers, we think that's awesome! Please be aware they are not officially supported and that it is very important to set up a dev environment to thoroughly test new releases.
Fleet supports single-writer database setups: one writable primary with read replicas. Multi-writer or group-replication MySQL setups are not supported.
If you use multiple databases per database server for multiple Fleet instances, you'll need to provision more resources for your database server to ensure performance. You can experiment with finding the right resourcing for your needs.
Redis
Fleet uses Redis to ingest and queue the results of distributed queries, cache data, etc. Many cloud providers (such as AWS and GCP) host reliable Redis services which you may consider for this purpose. A well supported Redis Docker image also exists if you would rather run Redis in a container. For more information on how to configure the fleet binary to use the correct Redis instance, see the Redis configuration documentation.
Systemd
Run with systemd
Once you've verified that you can run Fleet in your shell, you'll likely want to keep Fleet running in the background and after the server reboots. To do that we recommend using systemd.
Below is a sample unit file, assuming a fleet user exists on the system. Any user with sufficient
permissions to execute the binary, open the configuration files, and write the log files can be
used. It is also possible to run as root, though as with any other web server it is discouraged
to run Fleet as root.
[Unit]
Description=Fleet
After=network.target

[Service]
User=fleet
Group=fleet
LimitNOFILE=8192
ExecStart=/usr/local/bin/fleet serve \
  --mysql_address=127.0.0.1:3306 \
  --mysql_database=fleet \
  --mysql_username=root \
  --mysql_password=toor \
  --redis_address=127.0.0.1:6379 \
  --server_cert=/tmp/server.cert \
  --server_key=/tmp/server.key \
  --logging_json

[Install]
WantedBy=multi-user.target
Once you created the file, you need to move it to /etc/systemd/system/fleet.service and start the service.
sudo mv fleet.service /etc/systemd/system/fleet.service
sudo systemctl start fleet.service
sudo systemctl status fleet.service

sudo journalctl -u fleet.service -f
Making changes
Sometimes you'll need to update the systemd unit file defining the service. To do that, first open /etc/systemd/system/fleet.service in a text editor, and make your modifications.
Then, run
sudo systemctl daemon-reload
sudo systemctl restart fleet.service
TLS certificate
In order for osqueryd clients to connect, the connection to Fleet must use TLS. The TLS connection may be terminated by Fleet itself, or by a proxy serving traffic to Fleet.
- The CNAME or one of the Subject Alternate Names (SANs) on the certificate must match the hostname that osquery clients use to connect to the server/proxy.
- If you intend to have your Fleet instance on a subdomain, your certificate can have a wildcard SAN. So
fleet.example.comshould match a SAN of*.example.com - If self-signed certificates are used, the full certificate chain must be provided to osquery via the
--tls_server_certsflag. - If Fleet terminates TLS, consider using an ECDSA (rather than RSA) certificate, as RSA certificates have been associated with performance problems in Fleet due to Go's standard library TLS implementation.
Using a proxy
In enterprise environments where Fleet operates behind a proxy, you may need to configure proxy settings to enable services requiring outbound traffic, such as vulnerability processing or device management. Fleet automatically uses the HTTP_PROXY, HTTPS_PROXY, and NO_PROXY environment variables.
For example, to configure the proxy in a systemd service file:
[Service]
Environment="HTTP_PROXY=http(s)://PROXY_URL:PORT/"
Environment="HTTPS_PROXY=http(s)://PROXY_URL:PORT/"
Environment="NO_PROXY=localhost,127.0.0.1,::1"
Public IPs of devices
Fleet attempts to deduce the public IP of devices from well-known HTTP headers received on requests made by Fleet's agent (fleetd).
The HTTP request headers are checked in the following order:
- If
True-Client-IPheader is set, then Fleet will extract its value. - If
X-Real-IPheader is set, then Fleet will extract its value. - If
X-Forwarded-Forheader is set, then Fleet will extract the first comma-separated value. - If none of the above headers are present in the HTTP request then Fleet will attempt to use the remote address of the TCP connection (note that on deployments with ingress proxies the remote address seen by Fleet is the IP of the ingress proxy).
Reference configuration strategies
You can easily run Fleet on a single VPS that would be capable of supporting hundreds if not thousands of hosts, but this page details an opinionated view of running Fleet in a production environment, as well as different configuration strategies to enable High Availability (HA).
Availability components
There are a few strategies that can be used to ensure high availability:
- Database HA
- Traffic load balancing
Database HA
Fleet recommends RDS Aurora MySQL when running on AWS with backups turned on. It is also possible to dynamically scale read replicas to increase performance and enable database fail-over. It is also possible to use Aurora Global to span multiple regions for more advanced configurations (not included in the reference terraform).
In some cases adding a read replica can increase database performance for specific access patterns. In scenarios when automating the API or with fleetctl, there can be benefits to read performance.
Note:Fleet servers need to talk to a writer in the same datacenter. Cross region replication can be used for failover but writes need to be local.
Traffic load balancing
Load balancing enables distributing request traffic over many instances of the backend application. Using AWS Application Load Balancer can also offload SSL termination, freeing Fleet to spend the majority of its allocated compute dedicated to its core functionality.
Note if using terraform reference architecture all configurations can dynamically scale based on load(cpu/memory) and all configurations assume On-Demand pricing (savings are available through Reserved Instances). Calculations do not take into account NAT gateway charges or other networking related ingress/egress costs.
Cloud providers
Render
(Or any other PaaS)
Up to 300 hosts
See https://fleetdm.com/docs/deploy/deploy-fleet#render
AWS
Example configuration breakpoints
Up to 1000 hosts
| Fleet instances | CPU Units | RAM |
|---|---|---|
| 1 Fargate task | 512 CPU Units | 4GB |
| Dependencies | Version | Instance type | Nodes |
|---|---|---|---|
| Redis | 6 | cache.t4g.small | 3 |
| MySQL | 8.0.mysql_aurora.3.08.2 | db.t4g.medium | 2 |
Up to 25000 hosts
| Fleet instances | CPU Units | RAM |
|---|---|---|
| 10 Fargate task | 1024 CPU Units | 4GB |
| Dependencies | Version | Instance type | Nodes |
|---|---|---|---|
| Redis | 6 | cache.m6g.large | 3 |
| MySQL | 8.0.mysql_aurora.3.08.2 | db.r6g.large | 2 |
Up to 150000 hosts
| Fleet instances | CPU Units | RAM |
|---|---|---|
| 20 Fargate task | 1024 CPU Units | 4GB |
| Dependencies | Version | Instance type | Nodes |
|---|---|---|---|
| Redis | 6 | cache.m6g.large | 3 |
| MySQL | 8.0.mysql_aurora.3.08.2 | db.r6g.4xlarge | 2 |
Up to 300000 hosts
| Fleet instances | CPU Units | RAM |
|---|---|---|
| 20 Fargate task | 1024 CPU Units | 4GB |
| Dependencies | Version | Instance type | Nodes |
|---|---|---|---|
| Redis | 6 | cache.m6g.large | 3 |
| MySQL | 8.0.mysql_aurora.3.08.2 | db.r6g.16xlarge | 2 |
AWS reference architecture can be found in the reference terraform. This configuration includes:
- VPC
- Subnets
- Public & Private
- ACLs
- Security Groups
- Subnets
- ECS as the container orchestrator
- Fargate for underlying compute
- Task roles via IAM
- RDS Aurora MySQL 8
- Elasticache Redis Engine
- Firehose osquery log destination
- S3 bucket sync to allow further ingestion/processing
- Carves/software stored in an S3 bucket
Additional addons are available such as:
Some AWS services used in the provider reference architecture are billed as pay-per-use such as Firehose. This means that osquery scheduled query frequency can have a direct correlation to how much these services cost, something to keep in mind when configuring Fleet in AWS.
AWS Terraform CI/CD IAM permissions
The following permissions are the minimum required to apply AWS terraform resources:
{
    "Version": "2012-10-17",
    "Statement": [
        {
            "Effect": "Allow",
            "Action": [
                "ec2:*",
                "cloudwatch:*",
                "s3:*",
                "lambda:*",
                "ecs:*",
                "rds:*",
                "rds-data:*",
                "secretsmanager:*",
                "pi:*",
                "ecr:*",
                "iam:*",
                "aps:*",
                "vpc:*",
                "kms:*",
                "elasticloadbalancing:*",
                "ce:*",
                "cur:*",
                "logs:*",
                "cloudformation:*",
                "ssm:*",
                "sns:*",
                "elasticache:*",
                "application-autoscaling:*",
                "acm:*",
                "route53:*",
                "dynamodb:*",
                "kinesis:*",
                "firehose:*"
            ],
            "Resource": "*"
        }
    ]
}
GCP
GCP reference architecture can be found in the Fleet repository. This configuration includes:
- Cloud Run (Fleet backend)
- Cloud SQL MySQL 8.0 (Fleet database)
- Memorystore Redis (Fleet cache & live query orchestrator)
GCP support for add/install software and file carve features is coming soon. Get community support.
Example configuration breakpoints
Up to 1000 hosts
| Fleet instances | CPU | RAM |
|---|---|---|
| 2 Cloud Run | 1 | 2GB |
| Dependencies | Version | Instance type |
|---|---|---|
| Redis | MemoryStore Redis 6 | M1 Basic |
| MySQL | Cloud SQL for MySQL 8 | db-standard-1 |
Up to 25000 hosts
| Fleet instances | CPU | RAM |
|---|---|---|
| 10 Cloud Run | 1 | 2GB |
| Dependencies | Version | Instance type |
|---|---|---|
| Redis | MemoryStore Redis 6 | M1 2GB |
| MySQL | Cloud SQL for MySQL 8 | db-standard-4 |
Up to 150000 hosts
| Fleet instances | CPU | RAM |
|---|---|---|
| 30 Cloud Run | 1 CPU | 2GB |
| Dependencies | Version | Instance type | Nodes |
|---|---|---|---|
| Redis | MemoryStore Redis 6 | M1 4GB | 1 |
| MySQL | Cloud SQL for MySQL 8 | db-highmem-16 | 1 |
Azure
Coming soon. Get community support.
Render
Using Render's IAC see the repository for full details.
services:
  - name: fleet
    plan: standard
    type: web
    env: docker
    healthCheckPath: /healthz
    envVars:
      - key: FLEET_MYSQL_ADDRESS
        fromService:
          name: fleet-mysql
          type: pserv
          property: hostport
      - key: FLEET_MYSQL_DATABASE
        fromService:
          name: fleet-mysql
          type: pserv
          envVarKey: MYSQL_DATABASE
      - key: FLEET_MYSQL_PASSWORD
        fromService:
          name: fleet-mysql
          type: pserv
          envVarKey: MYSQL_PASSWORD
      - key: FLEET_MYSQL_USERNAME
        fromService:
          name: fleet-mysql
          type: pserv
          envVarKey: MYSQL_USER
      - key: FLEET_REDIS_ADDRESS
        fromService:
          name: fleet-redis
          type: pserv
          property: hostport
      - key: FLEET_SERVER_TLS
        value: false
      - key: PORT
        value: 8080

  - name: fleet-mysql
    type: pserv
    env: docker
    repo: https://github.com/render-examples/mysql
    branch: mysql-5
    disk:
      name: mysql
      mountPath: /var/lib/mysql
      sizeGB: 10
    envVars:
      - key: MYSQL_DATABASE
        value: fleet
      - key: MYSQL_PASSWORD
        generateValue: true
      - key: MYSQL_ROOT_PASSWORD
        generateValue: true
      - key: MYSQL_USER
        value: fleet

  - name: fleet-redis
    type: pserv
    env: docker
    repo: https://github.com/render-examples/redis
    disk:
      name: redis
      mountPath: /var/lib/redis
      sizeGB: 10
Digital Ocean
Using Digital Ocean's App Spec to deploy on the App on the App Platform
alerts:
- rule: DEPLOYMENT_FAILED
- rule: DOMAIN_FAILED
databases:
- cluster_name: fleet-redis
  engine: REDIS
  name: fleet-redis
  production: true
  version: "6"
- cluster_name: fleet-mysql
  db_name: fleet
  db_user: fleet
  engine: MYSQL
  name: fleet-mysql
  production: true
  version: "8"
domains:
- domain: demo.fleetdm.com
  type: PRIMARY
envs:
- key: FLEET_MYSQL_ADDRESS
  scope: RUN_TIME
  value: ${fleet-mysql.HOSTNAME}:${fleet-mysql.PORT}
- key: FLEET_MYSQL_PASSWORD
  scope: RUN_TIME
  value: ${fleet-mysql.PASSWORD}
- key: FLEET_MYSQL_USERNAME
  scope: RUN_TIME
  value: ${fleet-mysql.USERNAME}
- key: FLEET_MYSQL_DATABASE
  scope: RUN_TIME
  value: ${fleet-mysql.DATABASE}
- key: FLEET_REDIS_ADDRESS
  scope: RUN_TIME
  value: ${fleet-redis.HOSTNAME}:${fleet-redis.PORT}
- key: FLEET_SERVER_TLS
  scope: RUN_AND_BUILD_TIME
  value: "false"
- key: FLEET_REDIS_PASSWORD
  scope: RUN_AND_BUILD_TIME
  value: ${fleet-redis.PASSWORD}
- key: FLEET_REDIS_USE_TLS
  scope: RUN_AND_BUILD_TIME
  value: "true"
jobs:
- envs:
  - key: DATABASE_URL
    scope: RUN_TIME
    value: ${fleet-redis.DATABASE_URL}
  image:
    registry: fleetdm
    registry_type: DOCKER_HUB
    repository: fleet
    tag: latest
  instance_count: 1
  instance_size_slug: basic-xs
  kind: PRE_DEPLOY
  name: fleet-migrate
  run_command: fleet prepare --no-prompt=true db
  source_dir: /
name: fleet
region: nyc
services:
- envs:
  - key: FLEET_VULNERABILITIES_DATABASES_PATH
    scope: RUN_TIME
    value: /home/fleet
  health_check:
    http_path: /healthz
  http_port: 8080
  image:
    registry: fleetdm
    registry_type: DOCKER_HUB
    repository: fleet
    tag: latest
  instance_count: 1
  instance_size_slug: basic-xs
  name: fleet
  routes:
  - path: /
  run_command: fleet serve
  source_dir: /
Monitoring Fleet
Health checks
Fleet exposes a basic health check at the /healthz endpoint. This is the interface to use for simple monitoring and load-balancer health checks.
The /healthz endpoint will return an HTTP 200 status if the server is running and has healthy connections to MySQL and Redis. If there are any problems, the endpoint will return an HTTP 500 status. Details about failing checks are logged in the Fleet server logs.
Individual checks can be run by providing the check URL parameter (e.x., /healthz?check=mysql or /healthz?check=redis).
Metrics
Fleet exposes server metrics in a format compatible with Prometheus. A simple example Prometheus configuration is available in tools/app/prometheus.yml.
Prometheus can be configured to use a wide range of service discovery mechanisms within AWS, GCP, Azure, Kubernetes, and more. See the Prometheus configuration documentation for more information.
Alerting
Prometheus
Prometheus has built-in support for alerting through Alertmanager.
Consider building alerts for
- Changes from expected levels of host enrollment
- Increased latency on HTTP endpoints
- Increased error levels on HTTP endpoints
TODO (Seeking Contributors)
Add example alerting configurations
Cloudwatch Alarms
Cloudwatch Alarms can be configured to support a wide variety of metrics and anomaly detection mechanisms. There are some example alarms
in the terraform reference architecture (see monitoring.tf).
- Monitoring RDS (MySQL)
- ElastiCache for Redis
- Monitoring ECS
- Reference alarms include evaluating healthy targets & response times. We also use target-tracking alarms to manage auto-scaling.
Graphing
Prometheus provides basic graphing capabilities, and integrates tightly with Grafana for sophisticated visualizations.
Fleet server performance
Fleet is designed to scale to hundreds of thousands of online hosts. The Fleet server scales horizontally to support higher load.
Horizontal scaling
Scaling Fleet horizontally is as simple as running more Fleet server processes connected to the same MySQL and Redis backing stores. Typically, operators front Fleet server nodes with a load balancer that will distribute requests to the servers. All APIs in Fleet are designed to work in this arrangement by simply configuring clients to connect to the load balancer.
Availability
The Fleet/osquery system is resilient to loss of availability. Osquery agents will continue executing the existing configuration and buffering result logs during downtime due to lack of network connectivity, server maintenance, or any other reason. Buffering in osquery can be configured with the --buffered_log_max flag.
Note that short downtimes are expected during Fleet server upgrades that require database migrations.
Debugging performance issues
MySQL and Redis
If performance issues are encountered with the MySQL and Redis servers, use the extensive resources available online to optimize and understand these problems. Please file an issue with details about the problem so that Fleet developers can work to fix them.
Fleet server
For performance issues in the Fleet server process, please file an issue with details about the scenario, and attach a debug archive. Debug archives can also be submitted confidentially through other support channels.
Generate debug archive (Fleet 3.4.0+)
Use the fleetctl debug archive command to generate an archive of Fleet's full suite of debug profiles. See the fleetctl setup guide for details on configuring fleetctl.
The generated .tar.gz archive will be available in the current directory.
Targeting individual servers
In most configurations, the fleetctl client is configured to make requests to a load balancer that will proxy the requests to each server instance. This can be problematic when trying to debug a performance issue on a specific server. To target an individual server, create a new fleetctl context that uses the direct address of the server.
For example:
fleetctl config set --context server-a --address https://server-a:8080
fleetctl login --context server-a
fleetctl debug archive --context server-a
Confidential information
The fleetctl debug archive command retrieves information generated by Go's net/http/pprof package. In most scenarios this should not include sensitive information, however it does include command line arguments to the Fleet server. If the Fleet server receives sensitive credentials via CLI argument (not environment variables or config file), this information should be scrubbed from the archive in the cmdline file.
Community projects
Below are some projects created by Fleet community members. These projects provide additional solutions for deploying Fleet. Please submit a pull request if you'd like your project featured.
- CptOfEvilMinions/FleetDM-Automation - Ansible and Docker code to set up Fleet
![]() Back to top
Back to top
On this page: